Let us take a look at their financials.
Revenue
Revenue is in Korean Won in billions. From the above chart, it could be observed that revenue is flattish over the last 5 years.
If we look at revenue growth in percentage terms, the numbers fluctuate quite a fair bit. Over the 5-year period, the highest percentage growth in revenue over the previous year occurred in 2015. In two other years, there was negative growth in revenue.
Revenue by Product Category
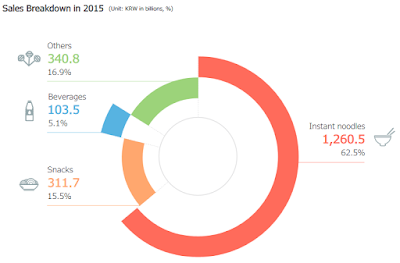
The above screenshot shows the revenue breakdown by product category for Nongshim, on a non-consolidated basis. Instant noodles, by far, contributes the higher percentage of revenue to the company. This is followed by snacks at 15%, with Export, Import brands, and Beverages accounting for the remaining percentages.
The revenue breakdown by product category has remained approximately constant. The screenshots below shows the revenue breakdown by product category for year 2016 and 2015, respectively.
Earnings
After looking at the top-line, let us take a look at the bottom-line. Compared to revenue, earnings fluctuate quite a fair bit across the last 5 years. As revenue is pretty much flattish, this suggests that there may be other extraneous factors that are impeding revenue from trickling down to the bottom-line.
Common Size Income Statement
I have prepared a Common Size Income Statement to help identify which areas could be responsible for the fluctuations in earnings across the last 5 years.
Over the years, cost of sales have decreased, resulting in an increase in the gross profit margin of the company. Another huge chunk of revenue is taken out at the Selling, General and Administrative Expenses level. The company is then left with operating profits hovering around at the 3 - 5% level across the 5 years. Beneath the Operating Profit level, it can be observed that Other Income played a significant role in enhancing net profits in 2016 relative to other years.
Balance Sheet
Over the 5-year period, total assets and total equity value have increased while total liabilities peaked at 2015 before falling.
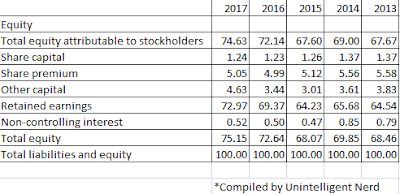
Similar to the Income Statement, I have also prepared a Common Size Balance Sheet to identify sub-component changes in the Balance sheet across time.
Across the 5-years, trade receivables ranged from 8-ish to 9-ish percent. As long as the percentage does not balloon over the years, this is not a cause for concern. Intangible assets only occupy a small position on the balance sheet over the 5 years.
The main bulk of current assets comes from short-term financial instruments, trade receivables, and inventory. The main bulk of non-current assets comes from tangible assets and real estate such as their production plants.
Retained earnings have increased from 64.54% in 2013 to 72.97% in 2017.
Cash Flow
Cash flow is the lifeblood of a business. How did Nongshim Co Ltd fare in this regard?
The above chart shows the Free Cash Flow for Nongshim Co Ltd across the five years. As there is no "Property, Plant and Equipment" entry on its Cash Flow Statement to subtract from Operating Cash Flow to determine Free Cash Flow, I followed Morningstar's approach where they used "Acquisition of tangible assets" as an equivalent to PP&E.
Dividend History
Nongshim is definitely not a dividend growth stock. Dividends distributed, on a per-share basis, have remained the same since 2004.
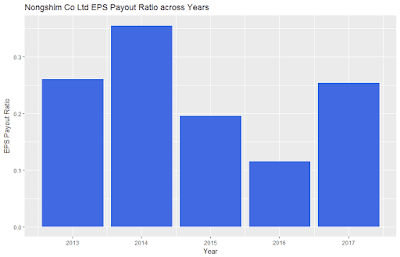
The EPS Payout Ratio is very healthy. For the past 5 years, dividends consumed less than 40% of earnings.
I was not able to find the number of shares outstanding from the 2017 annual report. I referred to Morningstar where they indicated that the number of shares outstanding was held constant at 6 millions shares for the past 5 years (2013 - 2017). With that information, I plotted the free cash flow payout ratio below.
In contrast, the FCF payout ratio chart paints a totally different picture. In 2014 and 2017, dividends paid were in negative territory. This mirrors the negative free cash flow in the Cash Flow section above.
That's all folks. Thanks for reading!
Not vested in Nongshim Co Ltd


Haha. Why are your analysis always/usually on companies you are not buying?
ReplyDeleteNow nothing to buy in the market mah. Good time to look see look see. When got sale, immediately can pounce on good deals ;)
DeleteThai Bev $0.78
DeleteScaled in more at $0.805. Yourself?
DeleteI went in earlier at $0.82. No wonder it keep falling because we keep buying. Hahahaha.
DeleteYah sia. KPOUN effect XD
DeleteNot buying anymore for now. Conserving cash
Hahaha. Same same but probably for a different reason... Wedding and honeymoon expenses coming in!
Delete